Google analytics from cristianpb.github.io
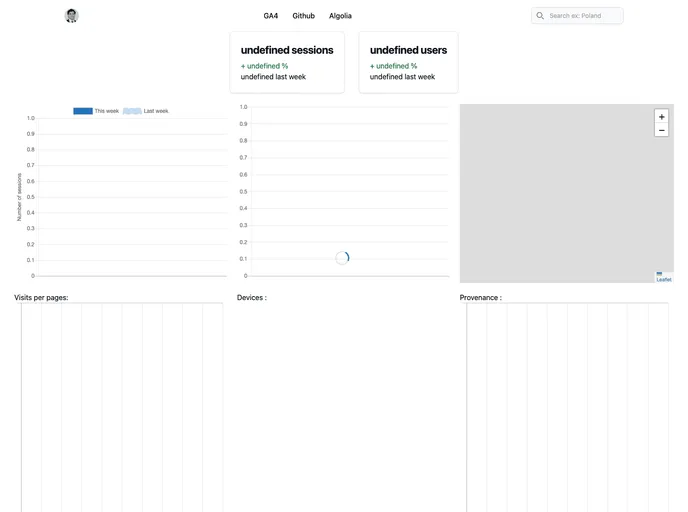
The Google Analytics Dashboard is a customized dashboard that allows users to connect to the Google Analytics API to fetch their analytics data. It makes use of the popular JavaScript libraries d3.js and dc.js to create interactive charts. The dashboard can be deployed automatically in a serverless architecture using GitHub Pages and GitHub Actions.
Connect to the Google Analytics API: The dashboard allows users to connect to the Google Analytics API to fetch their analytics data.
Interactive Charts: It makes use of the JavaScript libraries d3.js and dc.js to create interactive charts for data visualization.
Automatic Deployment: The dashboard can be automatically deployed using GitHub Pages and GitHub Actions, making it easy to publish and update the dashboard.
To install and set up the Google Analytics Dashboard, you can follow these steps:
Ensure that you have Python installed.
Enable Google API credentials to obtain a token and fetch Google Analytics data. Instructions for enabling the credentials can be found in the article.
Rename the credentials file as “token.json” (or any other desired name), and update the name in the “analytics.py” file if necessary.
Use the provided Makefile to start the development environment by running the following command:
make
To create a static HTML page for deployment, run the following command:
make dist
This will create a “dist” folder which contains the static page.
Deploy the HTML page to GitHub Pages by following the instructions provided in the article.
Use GitHub Actions to update the data on the dashboard as needed.
The Google Analytics Dashboard is a powerful tool that allows users to connect to the Google Analytics API, visualize their data using interactive charts, and deploy the dashboard easily with the help of GitHub Pages and GitHub Actions. With its customizable features and ease of installation, it provides a user-friendly solution for analyzing and tracking website analytics.