Overview
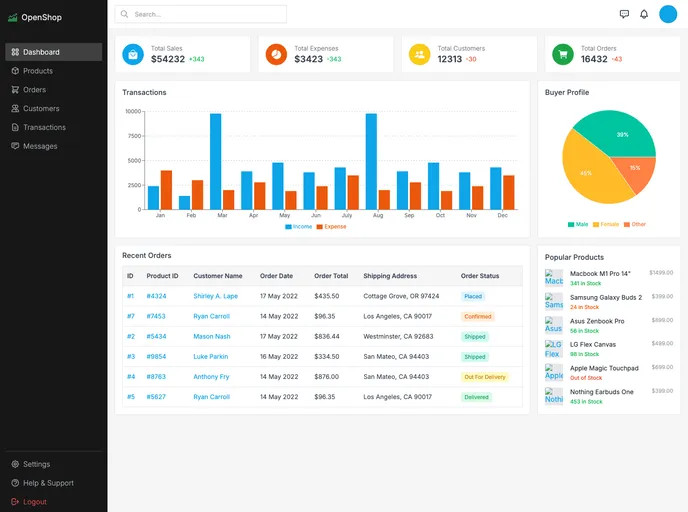
The Openshop Analytics Dashboard offers an impressive demo that showcases a sleek and user-friendly interface designed specifically for analytics purposes. Built with React, this dashboard provides a modern approach to data visualization, making it an ideal tool for users who want to track and analyze their data from multiple sources effectively. Its design is not only attractive but also functional, ensuring that important information can be processed and interpreted quickly.
Whether you’re managing a business, monitoring performance metrics, or simply looking to keep track of specific data points, the Openshop Analytics Dashboard stands out as a reliable solution. Its clean aesthetics paired with robust functionality make it appealing to both novice and experienced users alike.
Features
- User-Friendly Interface: The dashboard features an intuitive layout that simplifies navigation, allowing users to easily access various analytics tools and reports.
- Responsive Design: Built with a responsive framework, the dashboard adapts seamlessly across different devices, ensuring optimal usability on desktops, tablets, and smartphones.
- Real-Time Data Visualization: Users can visualize their data in real-time, thanks to dynamic charts and graphs that update automatically, making it easy to monitor trends and metrics continuously.
- Customization Options: Offers personalization features that allow users to customize the dashboard according to their preferences, including widgets and layout arrangements.
- Multiple Data Sources: Capable of integrating with various data sources, allowing for a comprehensive view of analytics without the need to toggle between different platforms.
- Detailed Reporting Features: Users can generate in-depth reports that tackle specific datasets, enhancing the ability to analyze performance and derive insights.
- Modern Aesthetics: The dashboard boasts a clean and beautiful UI that enhances the user experience while providing all necessary functions efficiently.